AI Tools and Software Sentiment: June 2026 in Review
July 2, 2026
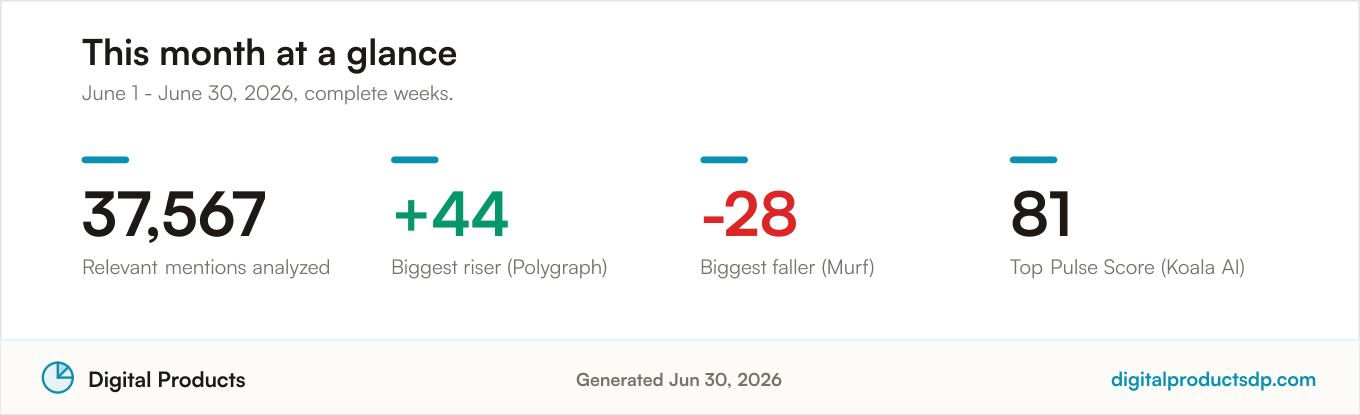
This report tracks aggregated public online discussion about AI tools and broader software, translating the tone of that chatter into Pulse Scores on a 0-100 scale. The figures here summarize community sentiment analyzed for June 1, 2026 through June 30, 2026, drawing on complete calendar weeks of collected discussion. Across the eligible field, we analyzed 37,567 relevant mentions spread over 227 products that cleared the minimum volume needed to be ranked.
Of the 2,235 products tracked in total, only those 227 reached the threshold of at least 10 relevant mentions in the window running from June 1, 2026 through June 30, 2026. What follows reads the scores and the underlying praise and complaint themes as signals of conversation, not as judgments about product quality. Where volumes are thin, we say so plainly.
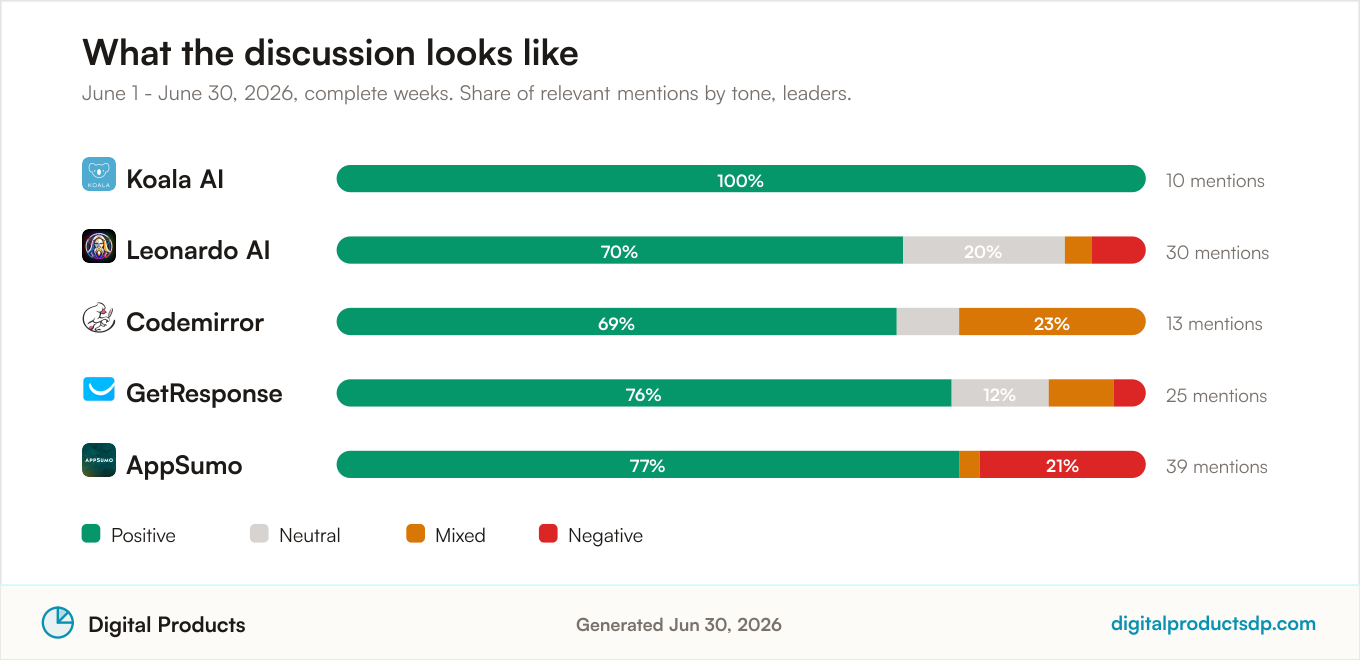
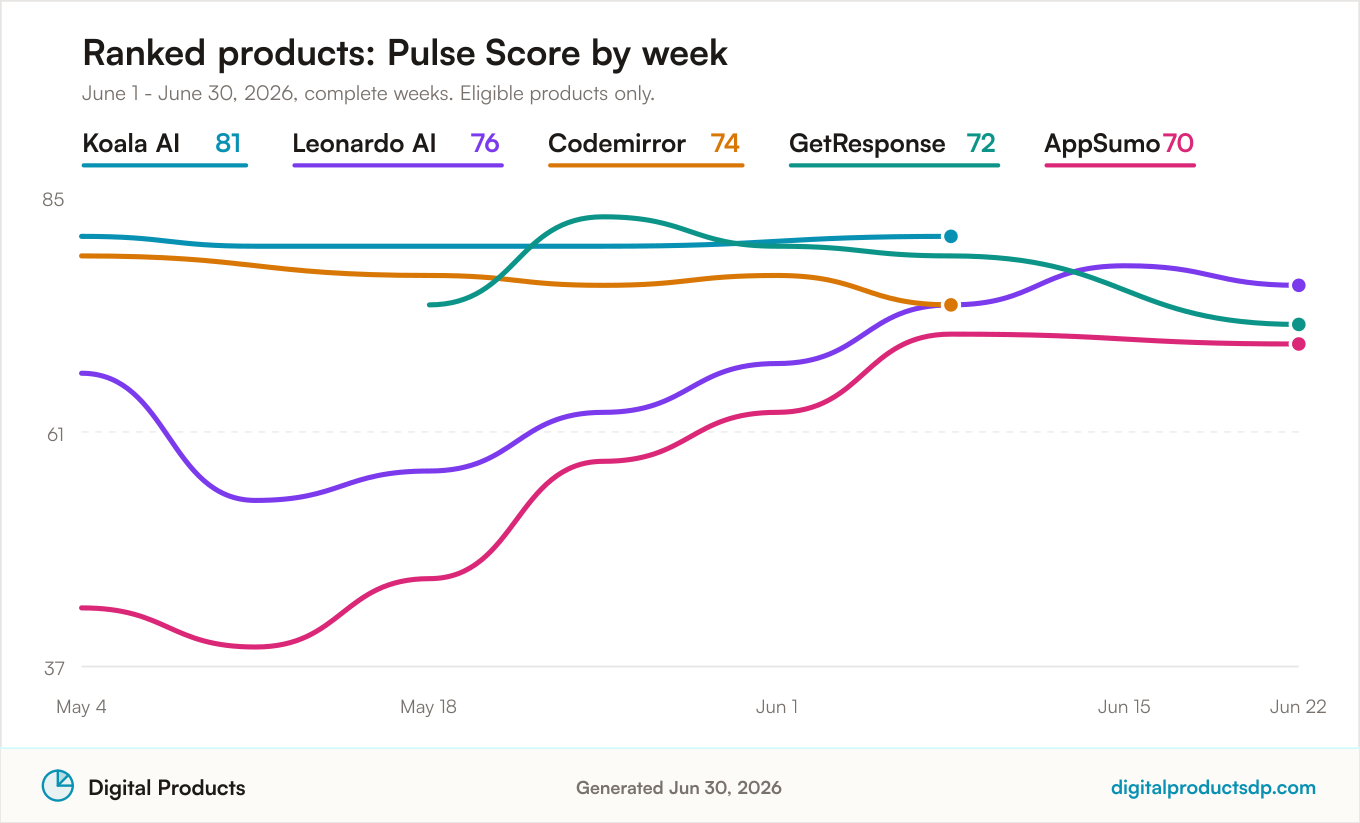
Koala AI, an AI writing tool, held the highest latest-week Pulse Score at 81, based on 10 mentions over the period. That sits just above Leonardo AI, an AI image tool, at 76 based on 30 mentions, and Codemirror, a coding tool, at 74 based on 13 mentions. GetResponse, a marketing platform, reached 72 based on 25 mentions, while AppSumo, a business product, rounded out the top five at 70 based on 39 mentions.
The spread among these leaders is narrow, and the mention counts behind them are modest. Koala AI's leading position rests on the smallest sample of the group, so its score reflects a small pool of favorable discussion rather than a broad consensus. AppSumo, by contrast, carries the largest sample of the five, which makes its climb into the top tier notable given the volume behind it.
Category View
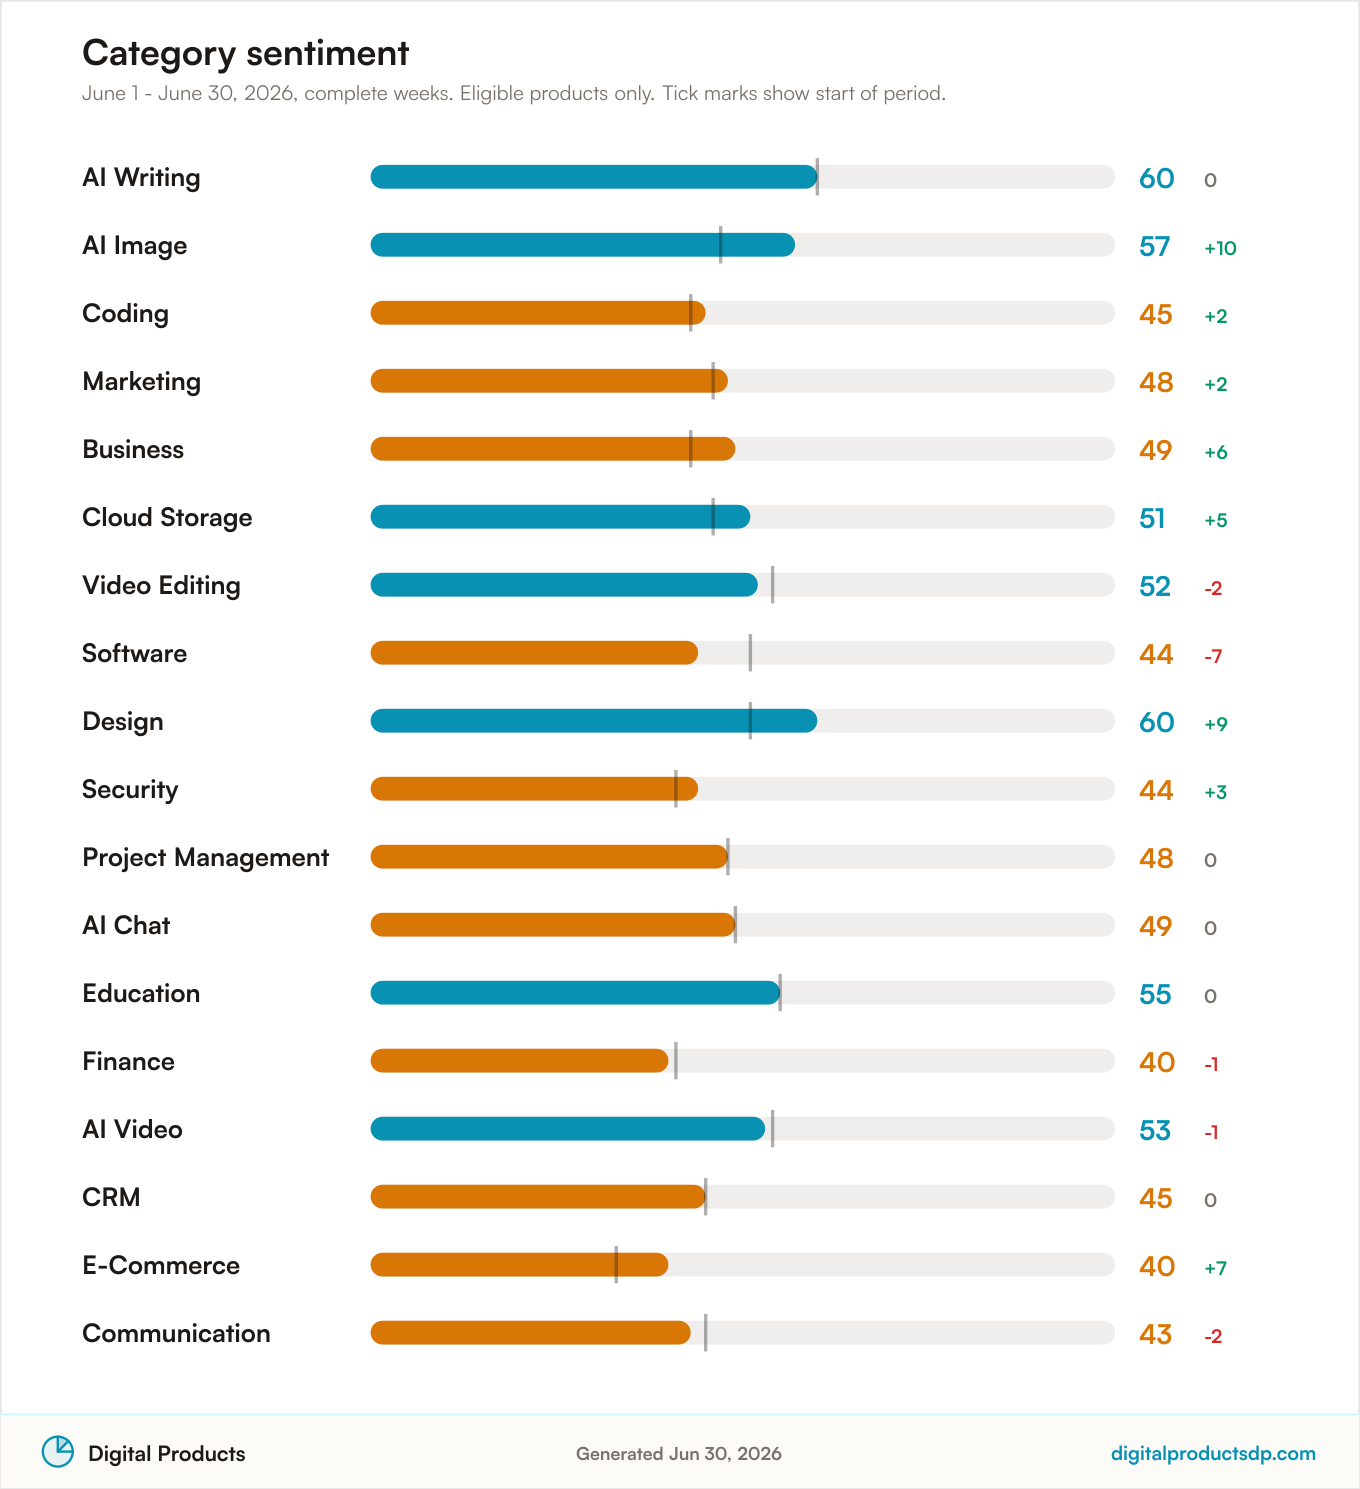
At the category level, the mood shifted most clearly upward for design, which moved from 51 to 60, and for ai-image, which climbed from 47 to 57. Business rose from 43 to 49, cloud-storage from 46 to 51, and e-commerce from 33 to 40, the last still the lowest-scoring category despite its gain. Movement in the other direction was more contained: software slipped from 51 to 44, video-editing eased from 54 to 52, and communication dipped from 45 to 43. Several categories held essentially flat, including ai-writing at 60, ai-chat at 49, project-management at 48, crm at 45, and education at 55. The overall picture is one of gradual firming in visual and infrastructure-adjacent categories, with pockets of softening rather than broad decline.
Biggest Movers
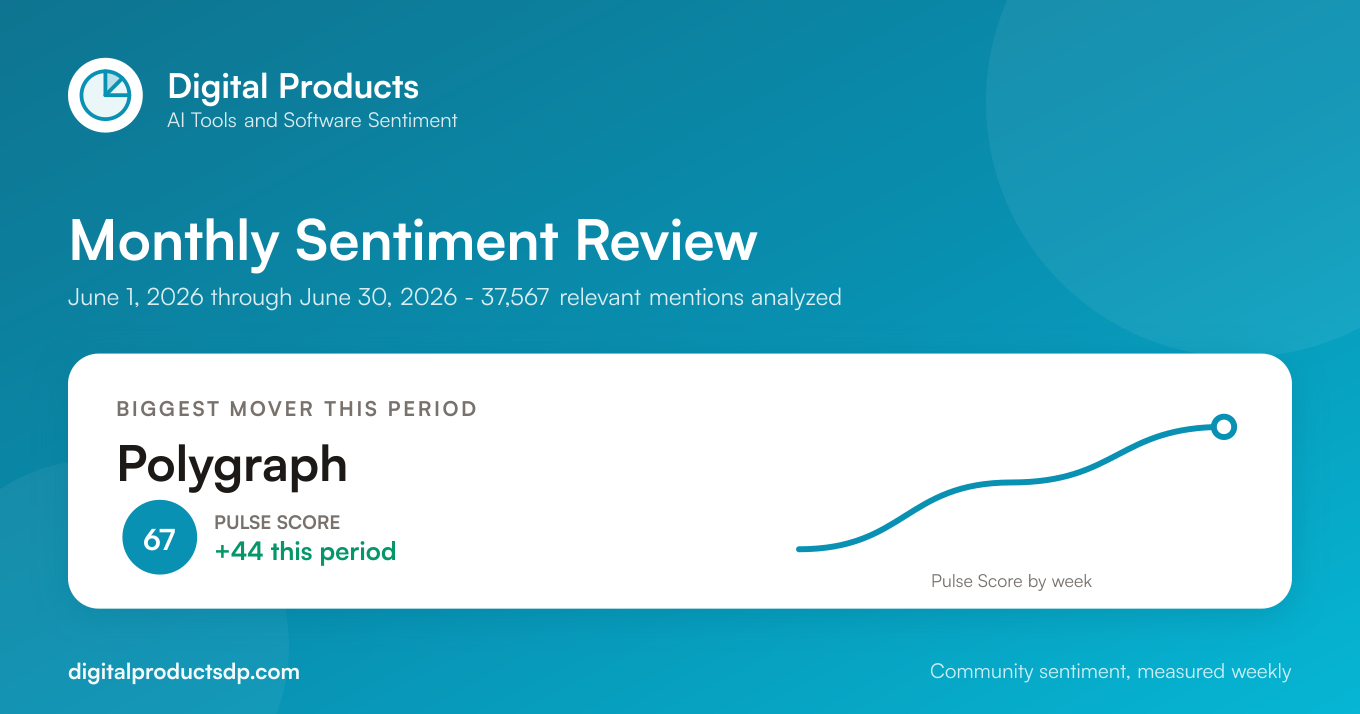
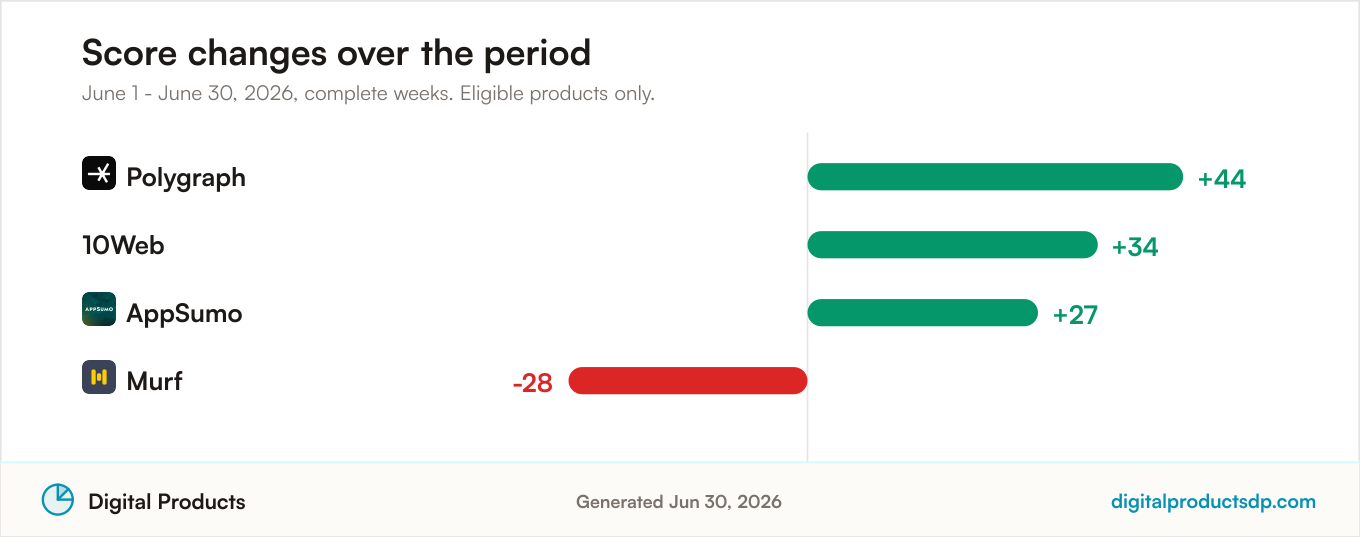
Polygraph was the largest riser, moving from 23 to 67 across the period, based on 21 mentions. Its praise conversation leaned on strong features with 12 mentions, new releases with 11, and good integrations with 9, a combination that reads like an early product gaining traction as people explore what it can do. The complaint side was lighter but present, with bugs at 4, missing features at 4, and feature requests at 3, the kind of wishlist-and-rough-edges chatter common to a fast-rising newcomer.
10Web rose from 15 to 49, based on 75 mentions, the largest sample among the risers. Its praise themes split evenly across AI quality, strong features, and comparisons to rivals, each at 6 mentions. The complaint conversation was heavier, led by comparisons to rivals at 9, missing features at 7, and learning curve at 5, suggesting the improvement in sentiment came alongside continued debate about how it stacks up and how easy it is to pick up.
AppSumo climbed from 43 to 70, based on 39 mentions, carrying it into the leaderboard. Its discussion was dominated by strong features at 22 mentions and fair pricing at 13, with comparisons to rivals at 3. Complaints were minimal, limited to a single mention each of pricing too high and comparisons to rivals. The praise around value and features appears to be the main driver of its upward move.
Murf was the steepest faller, dropping from 73 to 45, based on 23 mentions. Its complaint conversation centered on pricing changes at 5 mentions, comparisons to rivals at 4, and missing features at 3, while praise had thinned to a single mention each for AI quality, feels fast, and strong features. The concentration of pricing and competitive complaints alongside sparse praise lines up with the decline.
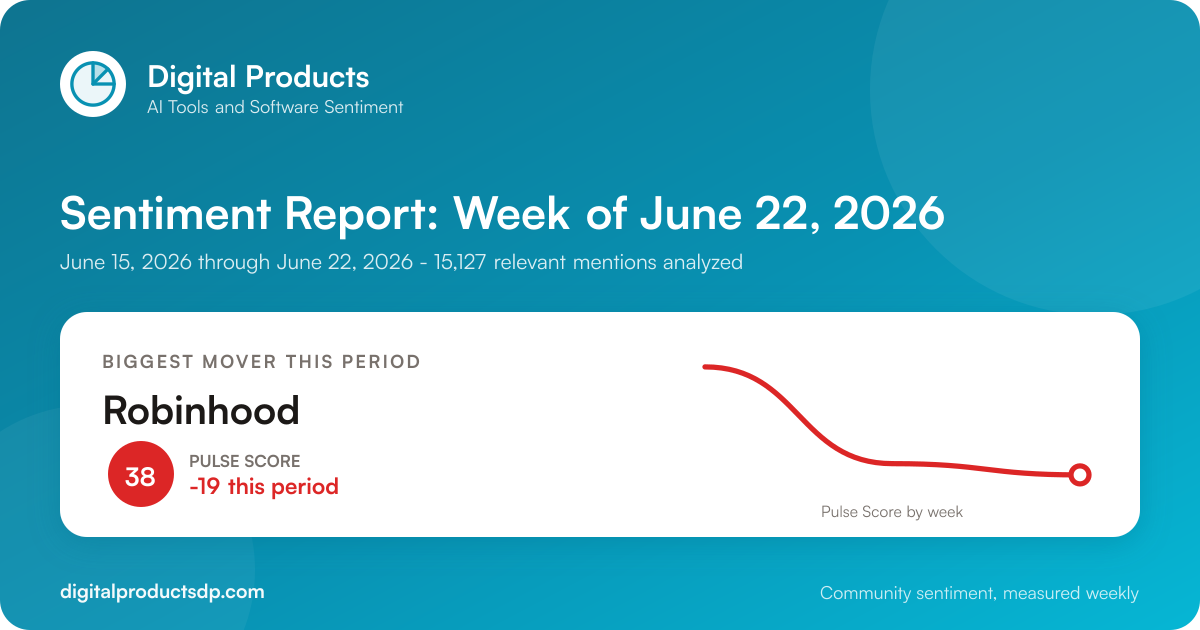
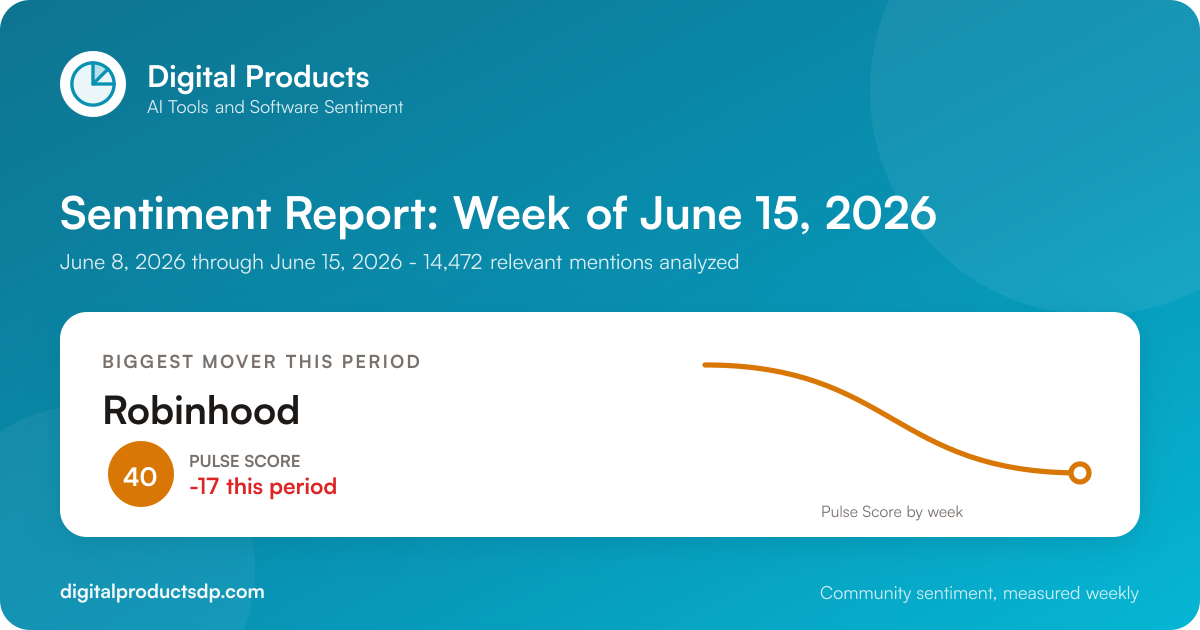
Robinhood fell from 65 to 38, based on 19 mentions. Praise was modest, with strong features at 4, good integrations at 4, and new releases at 3, while complaints ran to bugs at 11, reliability at 7, and lacking integrations at 3. The weight of bug and reliability chatter relative to a thin praise base tracks with the drop.
Luma AI declined from 78 to 54, based on 24 mentions. Its praise had narrowed to new releases at 5 mentions plus single mentions of AI quality and strong features, while complaints highlighted bugs at 3, reliability at 2, and performance at 2. The softening praise conversation and steady stream of stability complaints match its downward slope.
Spotlight: Koala AI
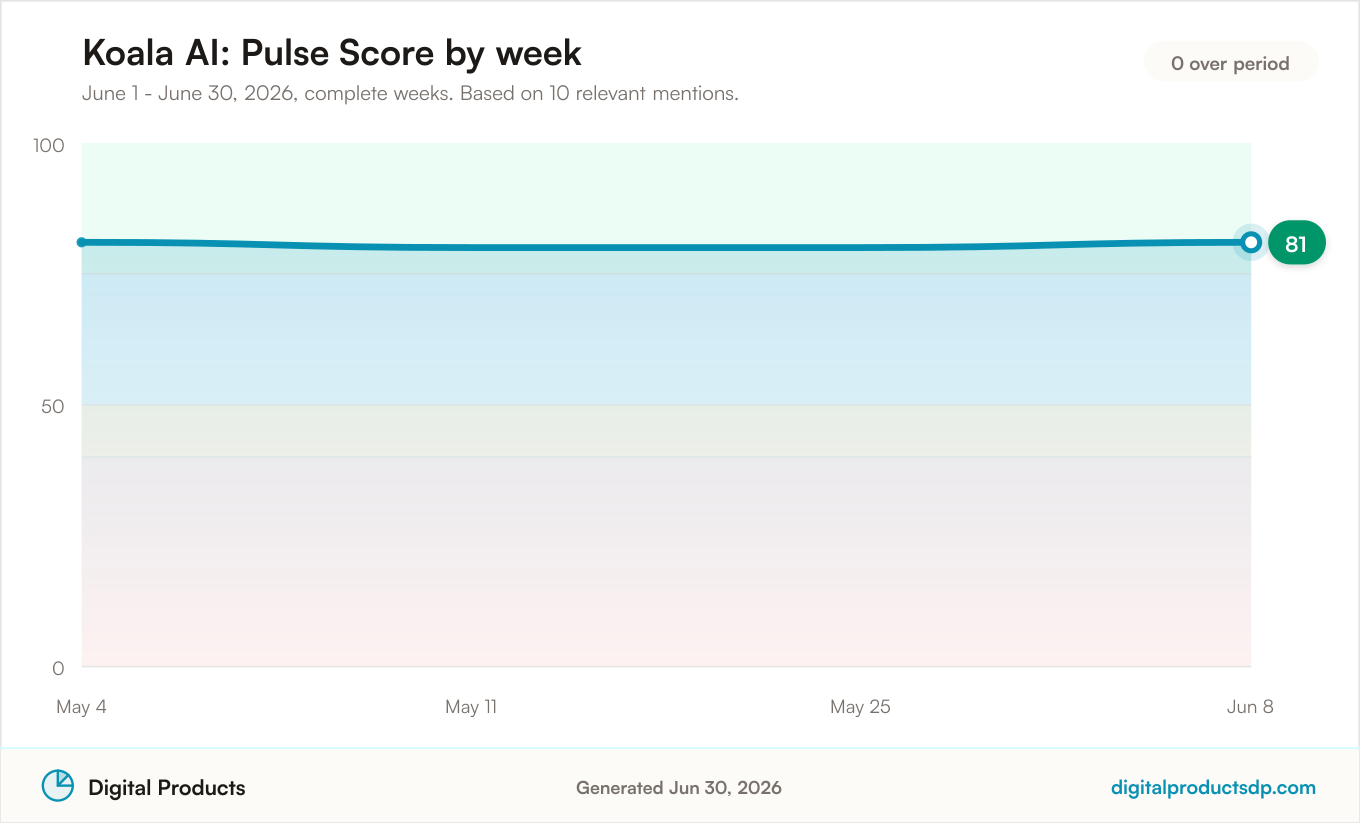
Koala AI, an AI writing tool, held the top Pulse Score at 81, based on 10 mentions over the period. Its weekly series was strikingly stable, reading 81 on May 4, 80 on May 11, 80 on May 25, and 81 on June 8. That flatness at a high level is a different pattern than the fast climbs of Polygraph or AppSumo; it reflects a small but consistently positive conversation rather than a surge.
The theme breakdown reinforces that read. Praise was led by strong features at 9 mentions, fair pricing at 7, and comparisons to rivals at 4, and there were no complaints recorded in the latest week. For a writing tool, a mix that pairs feature satisfaction with value perception and favorable head-to-head talk is a healthy signal within the discussion, even if the absolute volume is thin.
The caveat is exactly that volume. With 10 mentions, Koala AI sits right at the ranking threshold, so its leading position should be read as the tone of a small, favorable pool rather than a broad verdict. A handful of additional mentions in either direction could move its score meaningfully, which is worth keeping in mind when comparing it to higher-volume products lower on the board.
Themes Driving the Conversation
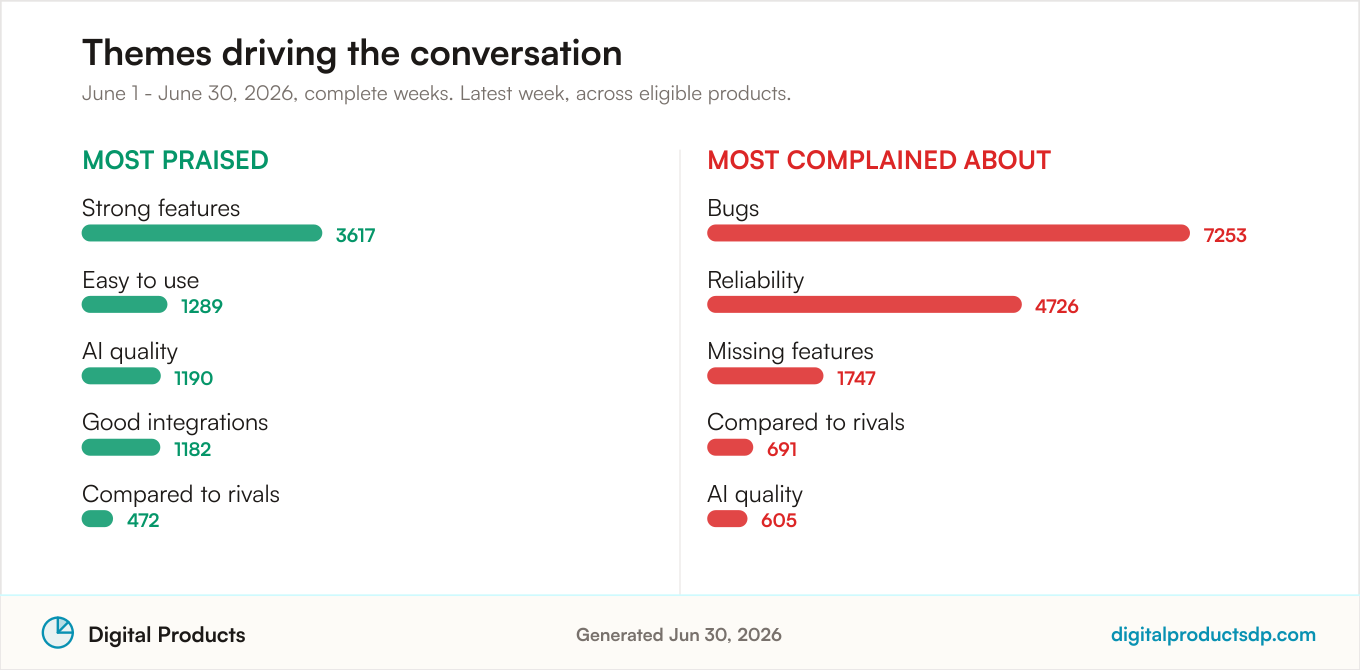
On the praise side, strong features dominated with 3,617 mentions, far ahead of easy to use at 1,289, AI quality at 1,190, good integrations at 1,182, and comparisons to rivals at 472. The feature theme showed up across the board, from Claude Code with 249 feature mentions and Claude with 229 to ChatGPT at 183 and Cloudflare at 117. AI quality praise clustered in the chat and image tools, with Claude at 234, Gemini at 149, and ChatGPT at 159 among the largest, and it also anchored Midjourney's positive discussion at 34 mentions.
The complaint conversation was heavier and more concentrated. Bugs led every other theme with 7,253 mentions, followed by reliability at 4,726, missing features at 1,747, comparisons to rivals at 691, and AI quality at 605. These themes drove the loudest complaint volumes at high-mention infrastructure and platform products: ClickHouse carried 441 bug mentions and 290 reliability mentions, CockroachDB 259 and 225, Rancher 243 and 159, ArgoCD 231 and 172, and Stripe 188 and 158. Notably, AI quality appeared on both the praise and complaint lists, showing up as a complaint for Grok at 183 mentions and Gemini at 112, a reminder that the same attribute can split opinion sharply within a single product's discussion.
Watchlist
A large number of tracked products did not clear the 10-mention threshold this period and are therefore excluded from the rankings. This is a statement about discussion volume, not about quality. Products can fall below the line simply because the sources we monitor did not carry enough relevant chatter in the window.
Several came close. IntelliJ IDEA, a coding tool, Visual Studio Code, a coding tool, Deel, a business product, Livestorm, a communication tool, and SaneBox, a business product, each landed at 9 relevant mentions, just short of eligibility. A step below, LookAway, Phabricator, CleverCrow, Elastic, Vultr, Vanta, WATI, ServiceNow, Microsoft Teams, and Airwallex each recorded 8 relevant mentions. A cluster including Haystack, Forte, Tresorit, AWeber, Checkly, New Relic, OpenStack, Snowplow, Hygraph, Final Cut Pro, ThorData, and Ribbon sat around 6 to 7 mentions.
Many more registered zero relevant mentions this period despite being tracked, spanning categories from CRM and marketing to communication and coding. For any of these, a single active discussion thread or a burst of review-video comments could be enough to push them over the threshold in a future report. We flag them here so their absence from the leaderboard is read correctly: too little signal to score, rather than a negative read.
What To Watch Next Month
First, watch whether Polygraph can hold its gains. Its move from 23 to 67 was steep and built on a thin base of 21 mentions, with new-release and feature enthusiasm doing much of the lifting. Whether that early positive tone persists as more discussion accumulates, and whether the bug and feature-request complaints grow, will be the thing to monitor.
Second, keep an eye on the design and ai-image categories, which posted the clearest upward category shifts this period, design from 51 to 60 and ai-image from 47 to 57. It is worth watching whether that firming continues or whether it was a single-period swing tied to specific products within those groups.
Third, the bug and reliability complaint themes remained dominant across high-volume infrastructure and platform products, with bugs at 7,253 mentions and reliability at 4,726 overall. Whether that pressure eases or intensifies for the largest-sample products like ClickHouse, CockroachDB, and Stripe is a signal to track, since those products carry enough volume to move category-level reads.
Frequently Asked Questions
Which tool had the highest Pulse Score in June 2026?
Koala AI, an AI writing tool, held the highest latest-week Pulse Score at 81, based on 10 mentions over the period.
Which product moved the most this period?
Polygraph was the biggest riser, climbing from 23 to 67 for a gain of 44 points, based on 21 mentions. On the downside, Murf fell the most, dropping from 73 to 45, based on 23 mentions.
How many mentions were analyzed?
A total of 37,567 relevant mentions were analyzed across the period, covering the 227 products that met the minimum volume to be ranked out of 2,235 tracked.
What themes dominated the conversation?
Strong features led the praise themes with 3,617 mentions, while bugs led the complaint themes with 7,253 mentions, ahead of reliability at 4,726.
About This Data
Pulse Scores summarize the tone of public online discussion on a 0-100 scale and reflect community sentiment. They are not a verdict on a product's quality and not a recommendation. We report on complete calendar weeks only, and products with fewer than 10 relevant mentions in the period are excluded from rankings to avoid unstable reads on thin samples.
Public discussion is collected from Hacker News, Stack Exchange, GitHub, Bluesky, the Apple App Store, and YouTube. Automated sentiment analysis can misread sarcasm, jokes, or niche context. Mention volumes vary widely between products, and scores can move week to week, so a small sample can shift a score quickly. Any company that wants to respond is welcome to reach out. For how scores are calculated, see our methodology.